5.2 Review of Anatomy & Physiology of the Cardiovascular System
Heart
Location of the Heart
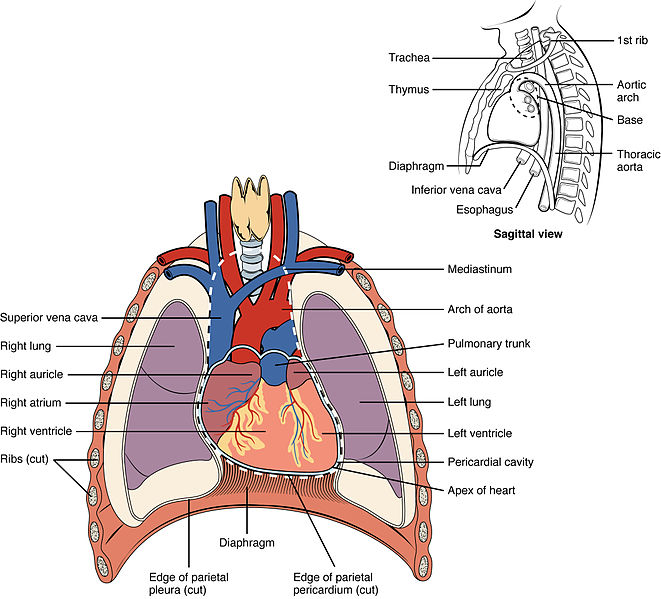
The human heart is located within the thoracic cavity, medially between the lungs in the space known as the mediastinum. The great veins, the superior and inferior venae cavae, and the great arteries, the aorta and pulmonary trunk, are attached to the superior surface of the heart, called the base. The base of the heart is located at the level of the third costal cartilage, as seen in Figure 5.1.[1] The inferior tip of the heart, the apex, lies just to the left of the sternum between the junction of the fourth and fifth ribs. It is important to remember the position of the heart when placing a stethoscope on the chest of a client and listening for heart sounds.[2]
Chambers and Circulation Through the Heart
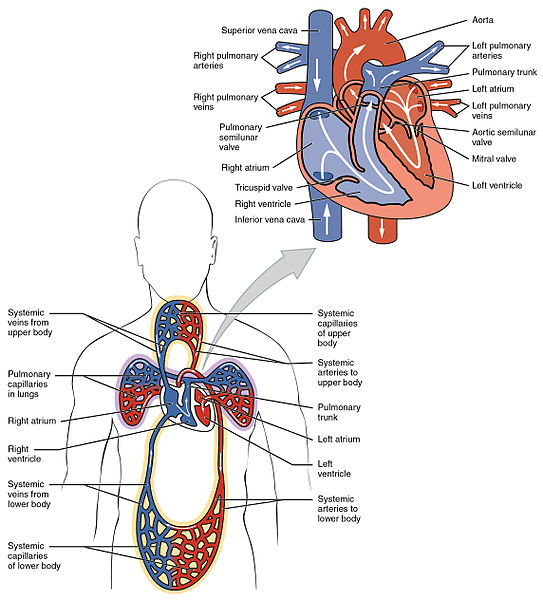
The heart consists of four chambers: two atria and two ventricles. The right atrium receives deoxygenated blood from the systemic circulation, and the left atrium receives oxygenated blood from the lungs. The atria contract to push blood into the lower chambers, the right ventricle and the left ventricle. The right ventricle contracts to push blood into the lungs, and the left ventricle is the primary pump that propels blood to the rest of the body.
There are two distinct but linked circuits in the human circulation called the pulmonary and systemic circuits. The pulmonary circuit transports blood to and from the lungs, where it picks up oxygen and delivers carbon dioxide for exhalation. The systemic circuit transports oxygenated blood to virtually all of the tissues of the body and returns deoxygenated blood and carbon dioxide to the heart to be sent back to the pulmonary circulation. See Figure 5.2[3] for an illustration of blood flow through the heart and blood circulation throughout the body.[4]
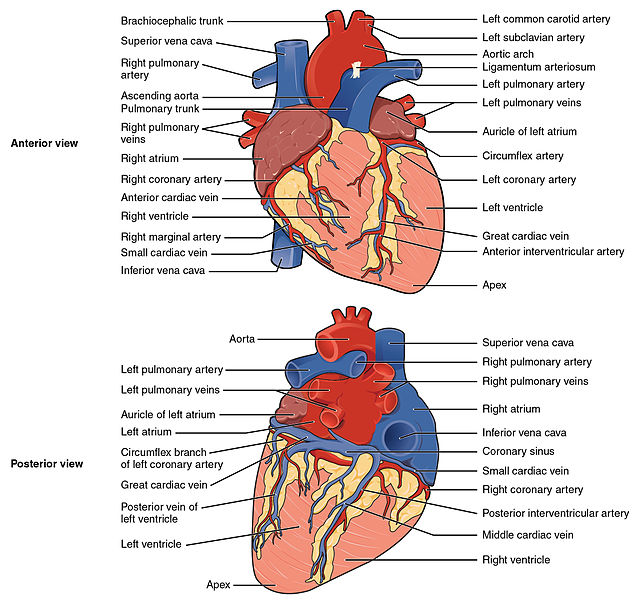
Blood also circulates through the coronary arteries with each beat of the heart. The left coronary artery distributes blood to the left side of the heart, and the right coronary distributes blood to the right atrium, portions of both ventricles, and the heart conduction system. See Figure 5.3[5] for an illustration of the coronary arteries. When a client has a myocardial infarction, a blood clot lodges in one of these coronary arteries that perfuse the heart tissue. If a significant area of muscle tissue dies from lack of perfusion, the heart is no longer able to pump.
Conduction System of the Heart
Contractions of the heart are stimulated by the electrical conduction system. The components of the cardiac conduction system include the sinoatrial (SA) node, the atrioventricular (AV) node, the bundle of His, the left and right bundle branches, and the Purkinje fibers. See Figure 5.4[6] for an image of the conduction system of the heart.
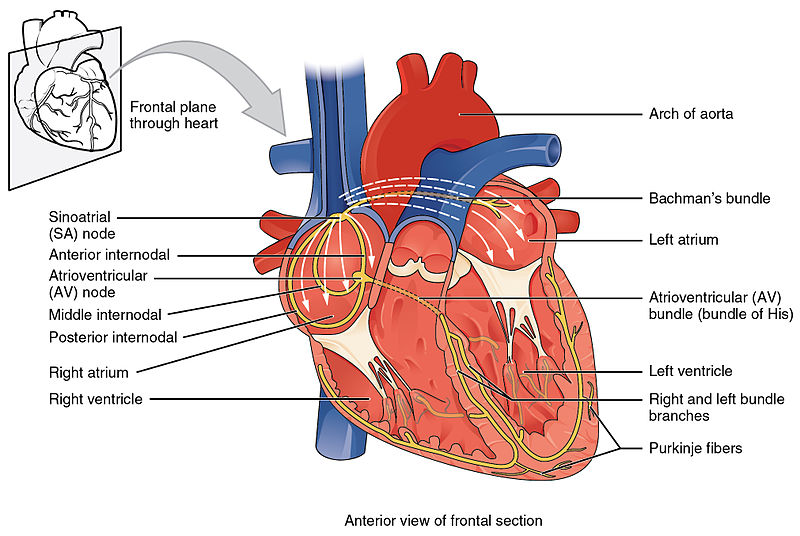
Normal cardiac rhythm is established by the sinoatrial (SA) node. The SA node has an intrinsic rate of 60-100 beats per minute and is known as the pacemaker of the heart. It initiates the sinus rhythm or normal electrical pattern followed by contraction of the heart. The SA node initiates the action potential, which sweeps across the atria through the AV node to the bundle branches and Purkinje fibers, and then spreads to the contractile fibers of the ventricle to stimulate the contraction of the ventricle.[7]
Cardiac Conductive Cells
Sodium (Na), potassium (K), and calcium (Ca2) ions play critical roles in cardiac conduction. Conductive cells contain a series of sodium ion channels that allow influx of sodium ions that cause the membrane potential to rise slowly and eventually cause spontaneous depolarization. Calcium ion channels open and Ca2 enters the cell, further depolarizing it. As the calcium ion channels then close, the K channels open, resulting in repolarization. When the membrane potential reaches approximately −60 mV, the K channels close and Na channels open, and the prepotential phase begins again. This phenomenon explains the autorhythmicity properties of cardiac muscle. Calcium ions play two critical roles in the physiology of cardiac muscle: conduction and contraction. In addition to depolarization, calcium ions also cause myosin to form cross bridges with the muscle cells that then provide the power stroke of contraction. Medications called calcium channel blockers thus affect both the conduction and contraction roles of calcium in the heart.[8]
Focus on Clinical Practice: The ECG
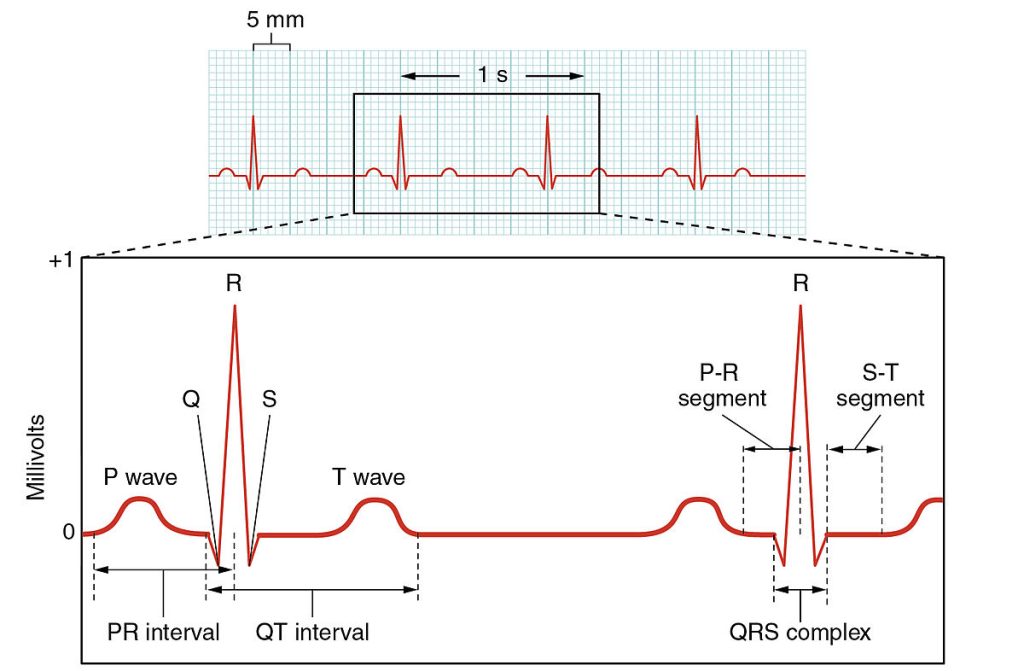
Surface electrodes placed on specific anatomical sites on the body can record the heart’s electrical signals. This tracing of the electrical signal is called an electrocardiogram (ECG), also historically abbreviated EKG. Careful analysis of an ECG reveals a detailed picture of both normal and abnormal heart function and is an indispensable clinical diagnostic tool. A normal ECG tracing is presented in Figure 5.5.[9] Each component, segment, and interval is labeled and corresponds to important electrical events.
There are five prominent components of the ECG: the P wave; the Q, R, and S components; and the T wave. The small P wave represents the depolarization of the atria. The large QRS complex represents the depolarization of the ventricles, which requires a much stronger impulse because of the larger size of the ventricular cardiac muscle. The ventricles begin to contract as the QRS reaches the peak of the R wave. Lastly, the T wave represents the repolarization of the ventricle. Several cardiac disorders can cause an altered conduction of the electrical signal through the heart, resulting in an abnormal rate or rhythm called dysrhythmia (also called arrhythmia).[10]
Cardiac Cycle
The period of time that begins with contraction of the atria and ends with ventricular relaxation is known as the cardiac cycle. The period of contraction that the heart undergoes while it pumps blood into circulation is called systole. The period of relaxation that occurs as the chambers fill with blood is called diastole.
Phases of the Cardiac Cycle
At the beginning of the cardiac cycle, both the atria and ventricles are relaxed, referred to as diastole. During diastole, blood flows into the right atrium from the superior and inferior venae cavae and into the left atrium from the four pulmonary veins. Contraction of the atria follows depolarization, which is represented by the P wave of the ECG. Just prior to atrial contraction, the ventricles contain approximately 130 mL of blood in a resting adult. This volume is known as the end diastolic volume or preload. As the atrial muscles contract, pressure rises within the atria, and blood is pumped into the ventricles.
Ventricular systole follows the depolarization of the ventricles and is represented by the QRS complex in the ECG. During the ventricular ejection phase, the contraction of the ventricular muscle causes blood to be pumped out of the heart. This quantity of blood is referred to as stroke volume (SV). Ventricular relaxation, or diastole, follows repolarization of the ventricles and is represented by the T wave of the ECG.[11]
Cardiac Output
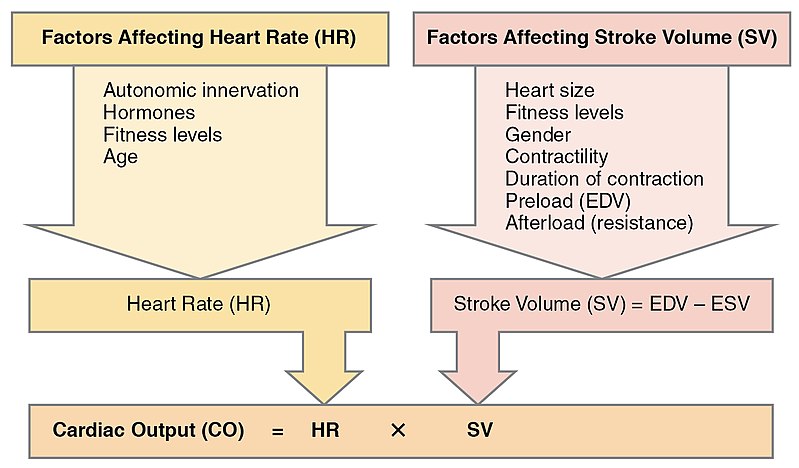
Cardiac output (CO) is a measurement of the amount of blood pumped by each ventricle in one minute. To calculate this value, multiply stroke volume (SV), the amount of blood pumped by the left ventricle, by the heart rate (HR) in beats per minute. It can be represented mathematically by the following equation: CO = HR × SV. Factors influencing CO are summarized in Figure 5.6[12] and include autonomic innervation by the sympathetic and parasympathetic nervous systems, hormones such as epinephrine, preload, contractility, and afterload. Each of these factors is further discussed below.[13] SV is also used to calculate ejection fraction, which is the portion of the blood that is pumped or ejected from the heart with each contraction.
Heart Rate
Heart rate (HR) can vary considerably, not only with exercise and fitness levels, but also with age. Newborn resting HRs may be 120 -160 bpm. HR gradually decreases until young adulthood and then gradually increases again with age. For an adult, normal resting HR will be in the range of 60–100 bpm. Bradycardia is the condition in which resting rate drops below 60 bpm, and tachycardia is the condition in which the resting rate is above 100 bpm.
Correlation Between Heart Rate and Cardiac Output
Conditions that cause increased HR also trigger an initial increase in SV. However, as the HR rises, there is less time spent in diastole and, consequently, less time for the ventricles to fill with blood. As HR continues to increase, SV gradually decreases due to less filling time. In this manner, tachycardia will eventually cause decreased cardiac output.
Autonomic Nervous Stimulation of Heart Rate and Contractility
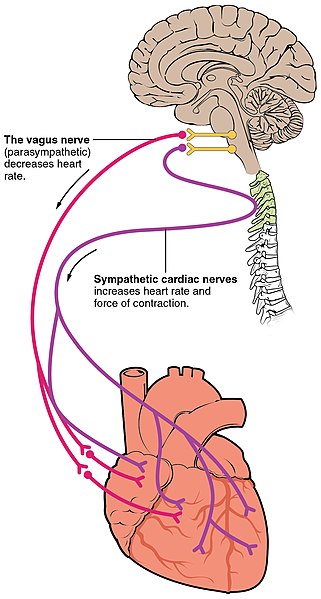
Sympathetic stimulation increases the heart rate and contractility, whereas parasympathetic stimulation decreases the heart rate. See Figure 5.7 for an illustration of the ANS stimulation of the heart.[14] Sympathetic stimulation causes the release of the neurotransmitter norepinephrine (NE), which shortens the repolarization period, thus speeding the rate of depolarization and contraction and increasing the HR. It also opens sodium and calcium ion channels, allowing an influx of positively charged ions.
NE binds to the Beta-1 receptor. Some cardiac medications (for example, beta-blockers) work by blocking these receptors, thereby slowing HR and lowering blood pressure. However, an overdose of beta-blockers can lead to bradycardia and even stop the heart.[15]
Stroke Volume
Many of the same factors that regulate HR also impact cardiac function by altering SV. Three primary factors that affect stroke volume are preload, or the stretch on the ventricles prior to contraction; contractility, or the force or strength of the contraction itself; and afterload, the force the ventricles must generate to pump blood against the resistance in the vessels. Many cardiovascular medications affect cardiac output by affecting preload, contractility, or afterload.[16]
Preload
Preload reflects the degree of myocardial stretch of muscle tissue at the end of diastole and before contraction. Preload is another way of describing end diastolic volume (EDV). Therefore, the greater the EDV is, the greater the preload is. One of the primary factors to consider is filling time, the duration of ventricular diastole during which filling occurs. Any sympathetic stimulation to the venous system will also increase venous return to the heart, which contributes to ventricular filling and preload. Medications such as diuretics decrease preload by causing the kidneys to excrete more water, thus decreasing blood volume.
Contractility
Contractility refers to the force of the contraction of the heart muscle, which controls SV. Factors that increase contractility are described as positive inotropic factors, and those that decrease contractility are described as negative inotropic factors.
Not surprisingly, sympathetic stimulation is a positive inotrope, whereas parasympathetic stimulation is a negative inotrope. The drug digoxin is used to lower HR and increase the strength of the contraction. It works by inhibiting the activity of an enzyme (ATPase) that controls movement of calcium, sodium, and potassium into heart muscle. Inhibiting ATPase increases calcium in heart muscle and, therefore, increases the force of heart contractions.
Negative inotropic agents include hypoxia, acidosis, hyperkalemia, and a variety of medications such as beta-blockers and calcium channel blockers.
Afterload
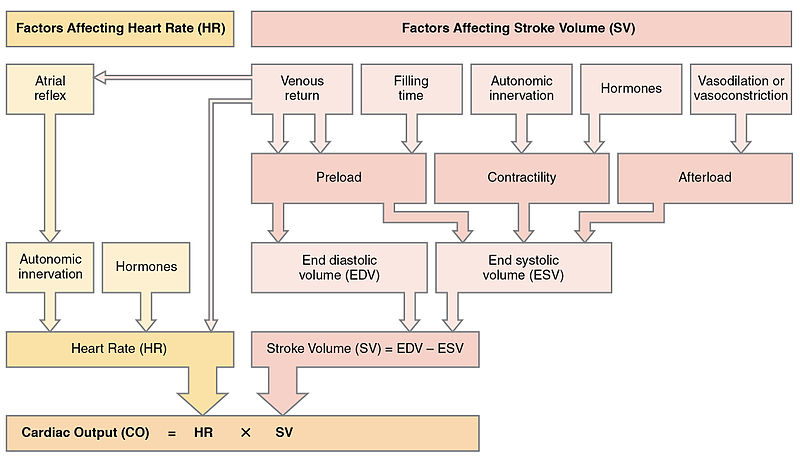
Afterload refers to the force that the ventricles must develop to pump blood effectively against the resistance in the vascular system. Any condition that increases resistance requires a greater afterload to force open the semilunar valves and pump the blood, which decreases cardiac output. On the other hand, any decrease in resistance reduces the afterload and then increases cardiac output. Figure 5.8[17] summarizes the major factors influencing cardiac output. Calcium channel blockers such as amlodipine, verapamil, nifedipine, and diltiazem can be used to reduce afterload and increase cardiac output.[18]
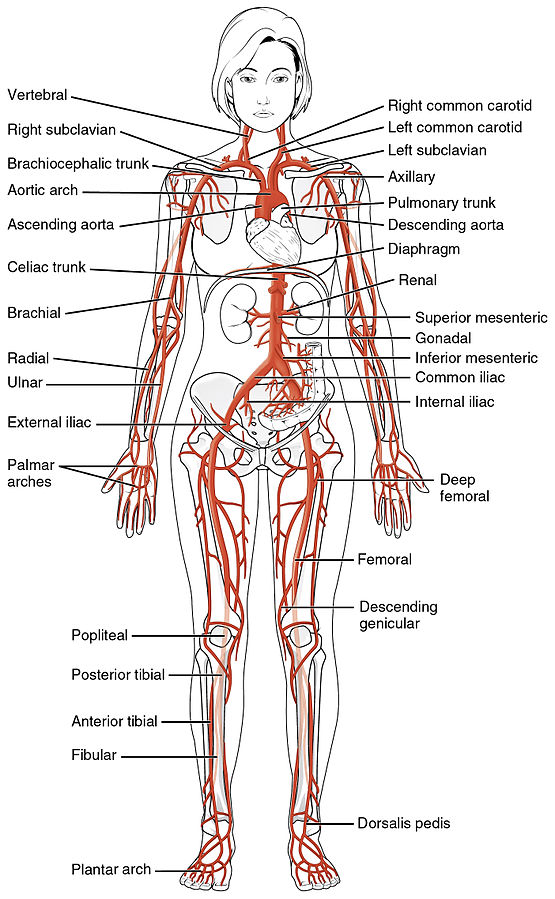
After blood is pumped out of the left ventricle into the aorta, it is carried through the body via the systemic arteries. An artery is a blood vessel that carries blood away from the heart, where it branches into ever-smaller arterioles and eventually into tiny capillaries. See Figure 5.9[19] for an illustration of the systemic arteries that carry oxygenated blood throughout the body to organs and tissues, as indicated by the red color.
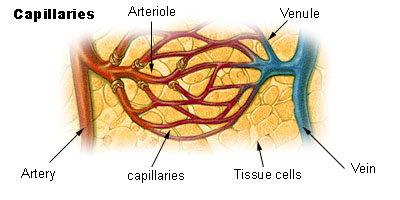
Oxygen and nutrients are exchanged with cells at the capillary level. A capillary is a microscopic channel that supplies blood to the tissue cells where nutrients and wastes are exchanged at the cellular level. Capillaries connect arterioles and venules, small veins. See Figure 5.10[20] for an illustration of capillaries supplying blood to tissue cells.
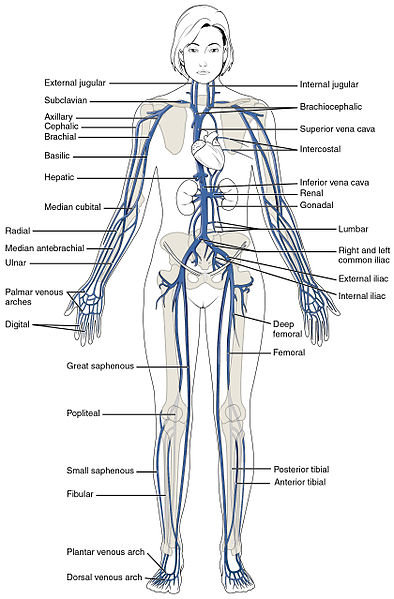
Venules carry blood to veins, a larger blood vessel that returns blood to the heart. Compared to arteries, veins are thin-walled, low-pressure vessels. Larger veins are also equipped with valves that promote the unidirectional flow of blood toward the heart and prevent backflow caused by the inherent low blood pressure in veins, as well as the pull of gravity. See Figure 5.11[21] for an illustration of the systemic veins.
In addition to their primary function of returning blood to the heart, veins may be considered blood reservoirs because systemic veins contain approximately 64 percent of the blood volume at any given time. Approximately 21 percent of the venous blood is located in venous networks within the liver, bone marrow, and integument. This volume of blood is referred to as venous reserve. Through venoconstriction, this reserve volume of blood can get back to the heart more quickly for redistribution to other parts of the circulation. Nitroglycerin is an example of a medication that causes arterial and venous vasodilation. It is used for clients with angina to decrease cardiac workload and increase the amount of oxygen available to the heart. By causing vasodilation of the veins, nitroglycerin decreases the amount of blood returned to the heart, which then decreases preload. It also reduces afterload by causing vasodilation of the arteries and reducing peripheral vascular resistance.[22]
Transportation of Blood
The systemic circulation transports blood and its components for physiological processes that occur throughout the body:
- The right ventricle pumps deoxygenated blood through the pulmonary arteries away from the heart to the lungs. Note this is the only place where arteries carry deoxygenated blood. Oxygen from the air breathed into the lungs diffuses into the pulmonary circulation in the alveoli. The pulmonary veins return oxygenated blood to the left atria of the heart, which moves into the left ventricle where it is pumped out to the rest of the body via the aorta to the systemic arteries.
- Nutrients from the foods eaten are absorbed in the digestive tract, where they diffuse into the systemic circulation and are transported throughout the body.
- Systemic arteries carry blood to the liver, where wastes are filtered out of the blood in the form of bile and nutrients and medications are metabolized.
- Systemic arteries carry blood to the kidneys, where wastes are filtered out and urine is created.
- Endocrine glands scattered throughout the body release hormones into the bloodstream, where they are transported to distant target cells.
Pulse
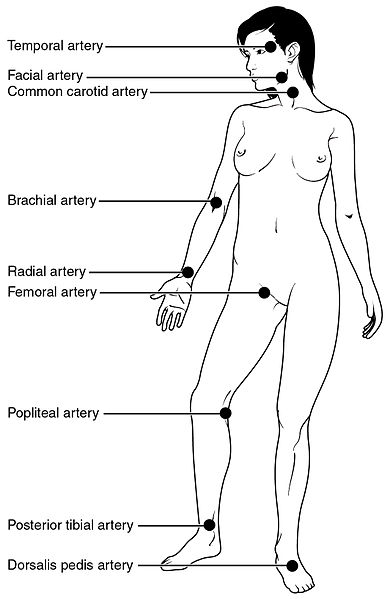
Each time the heart ejects blood forcefully into the circulation, the arteries expand and recoil to accommodate the surge of blood moving through them. This expansion and recoiling of the arterial wall is called the pulse and allows us to measure heart rate. The pulse can be palpated manually by placing the tips of the fingers across an artery that runs close to the body surface, such as the radial artery or the common carotid artery. Common pulse sites are shown in the Figure 5.12[23] below.
Both the rate and the strength of the pulse are important clinically. A high pulse rate can be temporarily caused by physical activity, but an extended fast or irregular pulse indicates a cardiac condition. The pulse strength indicates the strength of ventricular contraction, cardiac output, and perfusion. Recall that cardiac output is the amount of blood pumped by the heart per minute, and perfusion is the passage of blood through the blood vessels. If the pulse is strong, then cardiac output is high and perfusion to that site is good. If the pulse is weak, cardiac output is low or perfusion is impaired, and medical intervention may be warranted.
Blood Flow and Blood Pressure
Blood flow refers to the movement of blood through a vessel, tissue, or organ. Blood pressure is the force exerted by blood on the walls of the blood vessels. In clinical practice, this pressure is measured in mm Hg and is typically obtained using a sphygmomanometer (a blood pressure cuff) on the brachial artery of the arm. When systemic arterial blood pressure is measured, it is recorded as a ratio of two numbers expressed as systolic pressure over diastolic pressure (e.g., 120/80 is a normal adult blood pressure). The systolic pressure is the higher value (typically around 120 mm Hg) and reflects the arterial pressure resulting from the ejection of blood during ventricular contraction or systole. The diastolic pressure is the lower value (usually about 80 mm Hg) and represents the arterial pressure of blood during ventricular relaxation or diastole.
Three primary variables influence blood flow and blood pressure:
- Cardiac output
- Compliance of vessels
- Volume of the blood
Any factor that causes cardiac output to increase will elevate blood pressure and promote blood flow. Conversely, any factor that decreases cardiac output will decrease blood flow and blood pressure. See the previous “Cardiac Output” subsection for more information about factors that affect cardiac output.
Compliance is the ability of any compartment to expand to accommodate increased content. A metal pipe, for example, is not compliant, whereas a balloon is. The greater the compliance of an artery, the more effectively it is able to expand to accommodate surges in blood flow without increased resistance or blood pressure. When vascular disease causes arteriosclerosis (i.e., stiffening of arteries), compliance is reduced and resistance to blood flow is increased. The result is higher blood pressure within the vessel and reduced blood flow.
There is a relationship between blood volume, blood pressure, and blood flow. As an example, water may merely trickle along a creek bed in a dry season but rush quickly and under great pressure after a heavy rain. Similarly, as blood volume decreases, blood pressure and flow decrease, but when blood volume increases, blood pressure and flow increase.
Low blood volume, called hypovolemia, may be caused by bleeding, dehydration, vomiting, severe burns, or by diuretics used to treat hypertension. Treatment typically includes intravenous fluid replacement. Excessive fluid volume, called hypervolemia, is caused by retention of water and sodium, as seen in clients with heart failure, liver cirrhosis, and some forms of kidney disease. Treatment may include the use of diuretics that cause the kidneys to eliminate sodium and water.[24]
Edema
Despite the presence of valves within larger veins, over the course of a day, some blood will inevitably pool in the lower limbs, due to the pull of gravity. Any blood that accumulates in a vein will increase the pressure within it. Increased pressure will promote the flow of fluids out of the capillaries and into the interstitial fluid. The presence of excess fluid around the cells leads to a condition called edema. See Figure 5.13[25] for an image of a client with pitting edema. Edema can also be generalized and non-pitting.
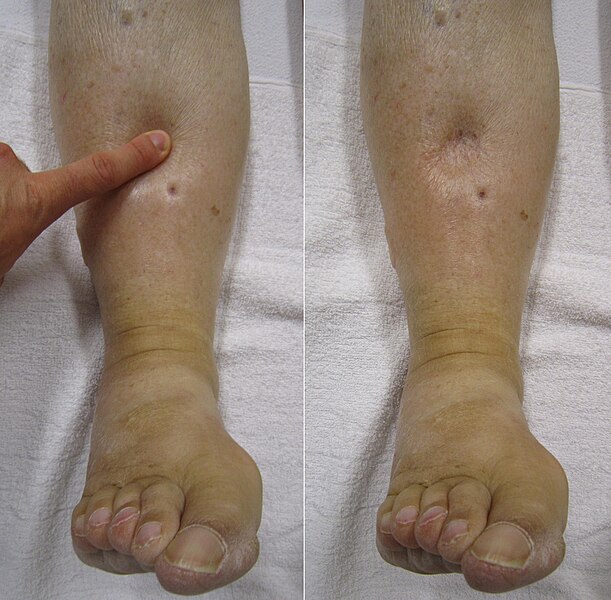
Most people experience a daily accumulation of fluid in their tissues, especially if they spend much of their time on their feet. However, clinical edema goes beyond normal swelling and requires medical treatment. Edema has many potential causes, including heart failure, severe protein deficiency, and renal failure. Diuretics such as furosemide are used to treat edema by causing the kidneys to eliminate sodium and water.[26] Read additional information about how to assess and document pitting edema in the “Assessment” subsection of the “General Cardiovascular System Assessment” section of this chapter.
Homeostatic Regulation of the Cardiovascular System
To maintain homeostasis in the cardiovascular system and provide adequate blood to the tissues, blood flow must be redirected continually to the tissues as they become more active. For example, when an individual is exercising, more blood will be directed to skeletal muscles, the heart, and the lungs. On the other hand, following a meal, more blood is directed to the digestive system. Only the brain receives a constant supply of blood regardless of rest or activity. Three homeostatic mechanisms ensure adequate blood flow and ultimately perfusion of tissues: autonomic nervous system, endocrine system, and autoregulatory mechanisms.
Autonomic Nervous System, Baroreceptors, and Chemoreceptors
The autonomic nervous system plays a critical role in the regulation of vascular homeostasis based on baroreceptors and chemoreceptors. Baroreceptors are specialized stretch receptors located within the aorta and carotid arteries that respond to the degree of stretch caused by the presence of blood and then send impulses to the cardiovascular center to regulate blood pressure. Baroreceptors sense changes in the level of pressure within the vessels. In addition to the baroreceptors, chemoreceptors monitor levels of oxygen, carbon dioxide, and hydrogen ions (pH). Chemoreceptors sense changes in the level of oxygen within the blood. When the cardiovascular center in the brain receives this input, it triggers a reflex that maintains homeostasis.
Endocrine Regulation
Endocrine control over the cardiovascular system involves catecholamines, epinephrine, and norepinephrine, as well as several hormones that interact with the kidneys in the regulation of blood volume.
Epinephrine and Norepinephrine
The catecholamines epinephrine and norepinephrine are released by the adrenal medulla and are a part of the body’s sympathetic or fight-or-flight response. They increase heart rate and force of contraction, while temporarily constricting blood vessels to organs not essential for flight-or-fight responses and redirecting blood flow to the liver, muscles, and heart.
Antidiuretic Hormone
Antidiuretic hormone (ADH), also known as vasopressin, is secreted by the hypothalamus. The primary trigger prompting the hypothalamus to release ADH is increasing osmolarity of tissue fluid, usually in response to significant loss of blood volume. ADH signals its target cells in the kidneys to reabsorb more water, thus preventing the loss of additional fluid in the urine. This will increase overall fluid levels and help restore blood volume and pressure.
Renin-Angiotensin-Aldosterone System
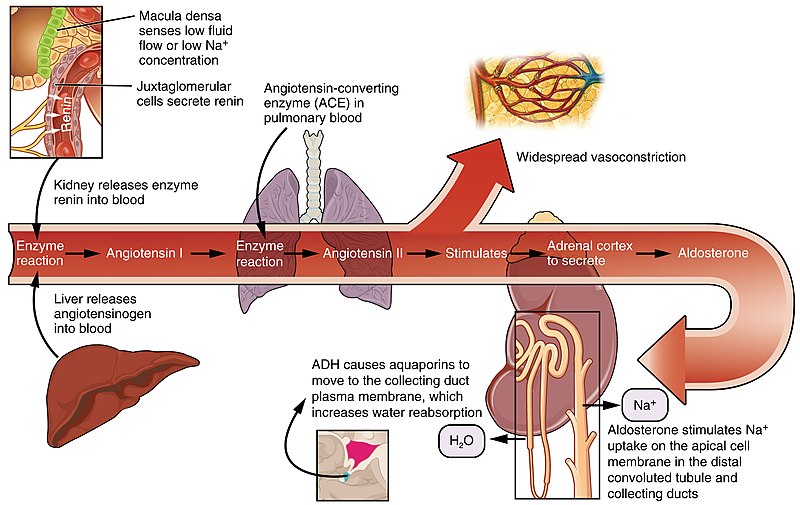
The renin-angiotensin-aldosterone system (RAAS) also has a major effect on the cardiovascular system. Specialized cells in the kidneys respond to decreased blood flow by secreting renin into the blood. Renin converts the plasma protein angiotensinogen into its active form—Angiotensin I. Angiotensin I circulates in the blood and is then converted into Angiotensin II in the lungs. This reaction is catalyzed by the enzyme called angiotensin-converting enzyme (ACE). Medications that impact angiotensin, such as angiotensin-converting enzyme (ACE) inhibitors or angiotensin receptor blockers (ARBs) target this step in the RAAS in an effort to decrease blood pressure.
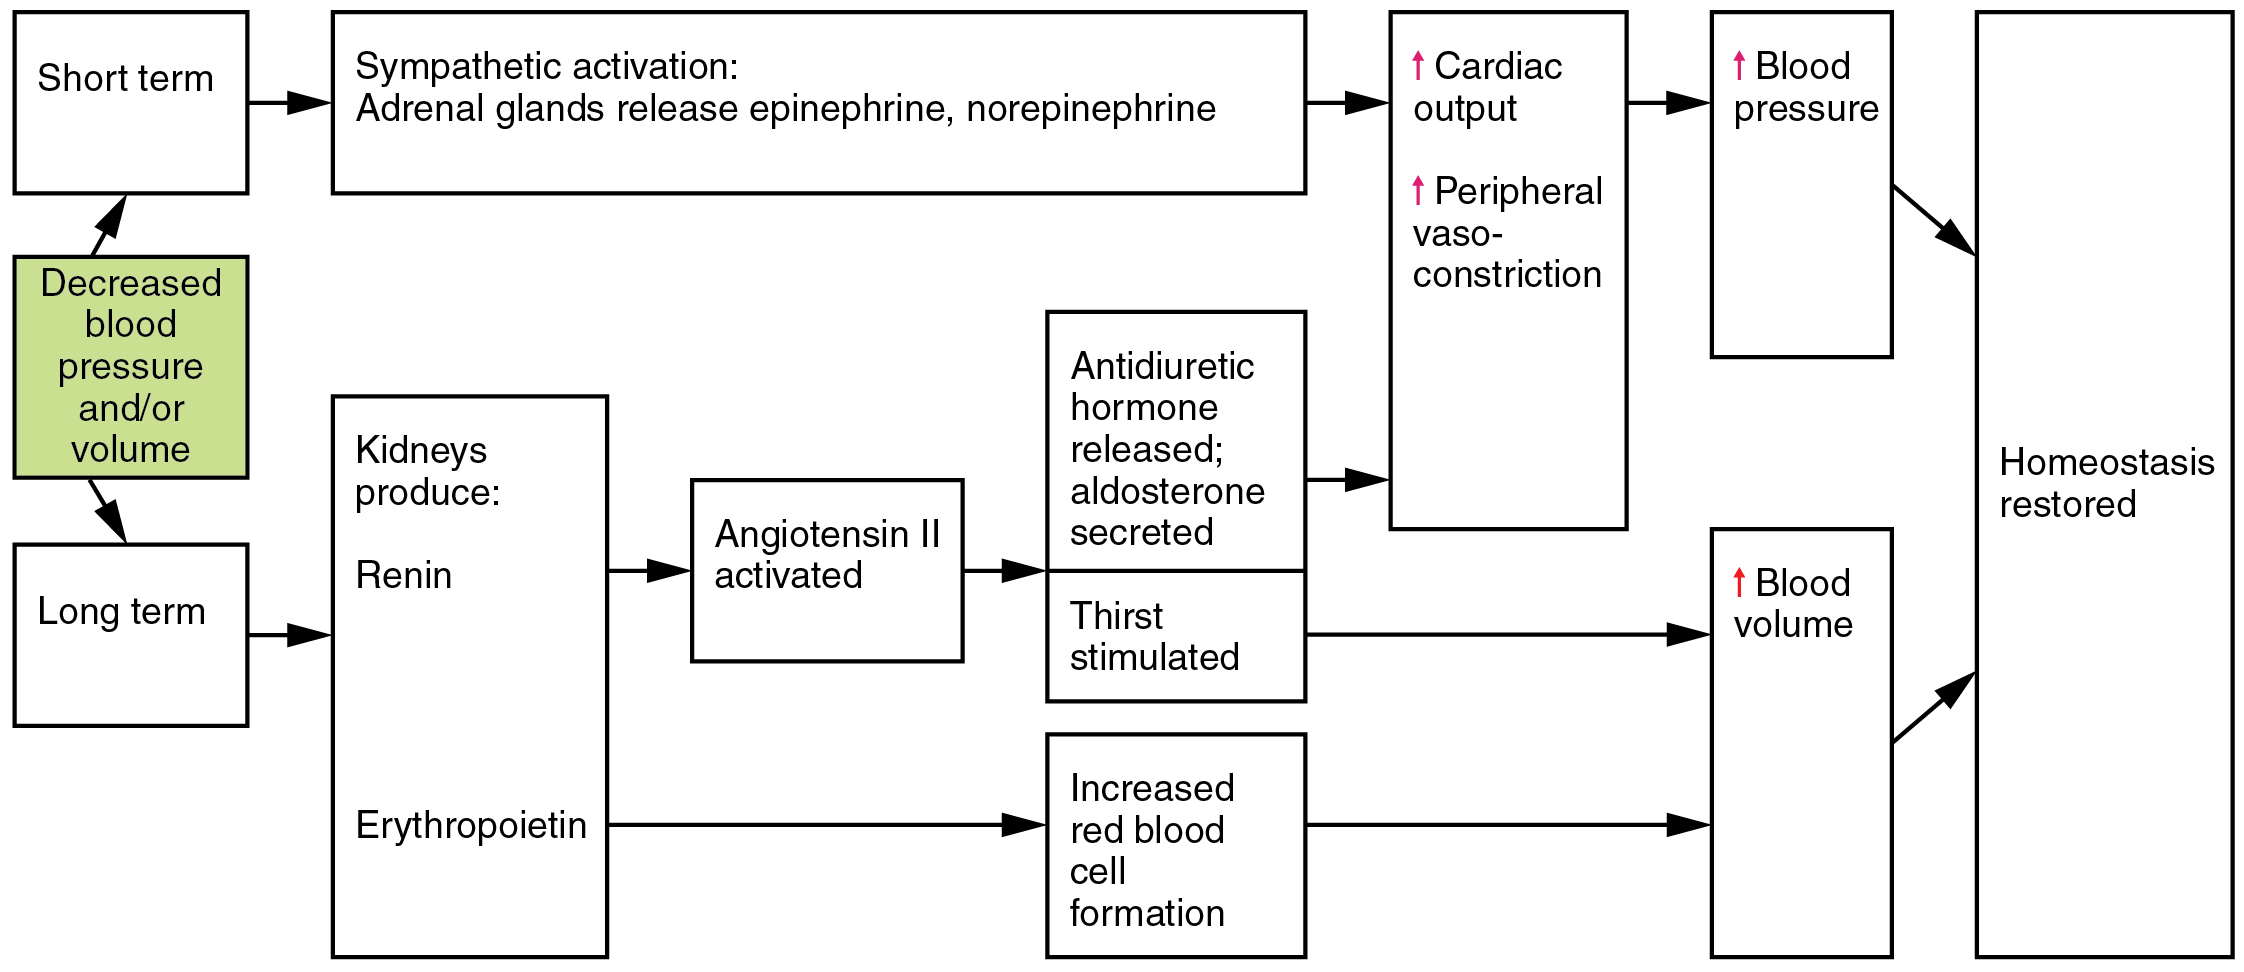
Angiotensin II is a powerful vasoconstrictor that greatly increases blood pressure. It also stimulates the release of ADH and aldosterone, a hormone produced by the adrenal cortex. Aldosterone then increases the reabsorption of sodium into the blood by the kidneys. Because water follows sodium, there is an increase in the reabsorption of water, which increases blood volume and blood pressure. See Figure 5.14[27] for an illustration of the renin-angiotensin-aldosterone system. See Figure 5.15 [28] for a summary of the effect of hormones involved in renal control of blood pressure.
Autoregulatory Mechanisms of Perfusion
Local, autoregulatory mechanisms allow each region of tissue to adjust its blood flow—and thus its perfusion. These mechanisms are affected by sympathetic and parasympathetic stimulation, as well as endocrine factors. See Table 5.2 for a summary of these factors and their effects.[29]
Table 5.2. Effects of Nervous System, Endocrine, and Local Controls on the Vasoconstriction and Vasodilation of Arterioles
| Control | Factor | Vasoconstriction | Vasodilation |
|---|---|---|---|
| Autonomic Nervous System | Sympathetic stimulation | Arterioles within integument, abdominal viscera, and mucosa membrane; skeletal muscles (at high levels); varied in veins and venules | Arterioles within heart; skeletal muscles at low to moderate levels |
| Parasympathetic | No known innervation for most | Arterioles in external genitalia; no known innervation for most other arterioles or veins | |
| Endocrine | Epinephrine | Similar to sympathetic stimulation for extended flight-or-fight responses; at high levels, binds to specialized alpha (α)-receptors | Similar to sympathetic stimulation for extended fight-or-flight responses; at low to moderate levels, binds to specialized beta (β)-receptors |
| Norepinephrine | Similar to epinephrine | Similar to epinephrine | |
| Angiotensin II | Powerful generalized vasoconstrictor; also stimulates release of aldosterone and ADH | N/A | |
| ADH | Moderately strong generalized vasoconstrictor; also causes body to retain more fluid via kidneys, increasing blood volume and pressure | N/A |
- “Position of the Heart in the Thorax” by OpenStax College is licensed under CC BY 4.0. Access for free at https://openstax.org/books/anatomy-and-physiology/pages/19-1-heart-anatomy ↵
- Betts, J. G., Young, K. A., Wise, J. A., Johnson, E., Poe, B., Kruse, D. H., Korol, O., Johnson, J. E., Womble, M., & DeSaix, P. (2022). Anatomy and Physiology 2e. OpenStax. https://openstax.org/books/anatomy-and-physiology-2e/pages/1-introduction ↵
- “Dual System of the Human Blood Circulation” by OpenStax College is licensed under CC By 4.0. Access for free at https://openstax.org/books/anatomy-and-physiology/pages/19-1-heart-anatomy ↵
- Betts, J. G., Young, K. A., Wise, J. A., Johnson, E., Poe, B., Kruse, D. H., Korol, O., Johnson, J. E., Womble, M., & DeSaix, P. (2022). Anatomy and Physiology 2e. OpenStax. https://openstax.org/books/anatomy-and-physiology-2e/pages/1-introduction ↵
- “Surface Anatomy of the Heart” by OpenStax College is licensed under CC BY 4.0. Access for free at https://openstax.org/books/anatomy-and-physiology/pages/19-1-heart-anatom ↵
- “2018 Conduction System of the Heart” by OpenStax College is licensed under CC BY 4.0. Access it for free at https://openstax.org/books/anatomy-and-physiology/pages/19-2-cardiac-muscle-and-electrical-activity ↵
- Betts, J. G., Young, K. A., Wise, J. A., Johnson, E., Poe, B., Kruse, D. H., Korol, O., Johnson, J. E., Womble, M., & DeSaix, P. (2022). Anatomy and Physiology 2e. OpenStax. https://openstax.org/books/anatomy-and-physiology-2e/pages/1-introduction ↵
- Betts, J. G., Young, K. A., Wise, J. A., Johnson, E., Poe, B., Kruse, D. H., Korol, O., Johnson, J. E., Womble, M., & DeSaix, P. (2022). Anatomy and Physiology 2e. OpenStax. https://openstax.org/books/anatomy-and-physiology-2e/pages/1-introduction ↵
- “2022_Electrocardiogram.jpg” by OpenStax College is licensed under CC BY 3.0. ↵
- Betts, J. G., Young, K. A., Wise, J. A., Johnson, E., Poe, B., Kruse, D. H., Korol, O., Johnson, J. E., Womble, M., & DeSaix, P. (2022). Anatomy and Physiology 2e. OpenStax. https://openstax.org/books/anatomy-and-physiology-2e/pages/1-introduction ↵
- Betts, J. G., Young, K. A., Wise, J. A., Johnson, E., Poe, B., Kruse, D. H., Korol, O., Johnson, J. E., Womble, M., & DeSaix, P. (2022). Anatomy and Physiology 2e. OpenStax. https://openstax.org/books/anatomy-and-physiology-2e/pages/1-introduction ↵
- “2031 Factors in Cardiac Output.jpg” by OpenStax College is licensed under CC BY 4.0. Access for free at https://openstax.org/books/anatomy-and-physiology/pages/19-4-cardiac-physiology ↵
- Betts, J. G., Young, K. A., Wise, J. A., Johnson, E., Poe, B., Kruse, D. H., Korol, O., Johnson, J. E., Womble, M., & DeSaix, P. (2022). Anatomy and Physiology 2e. OpenStax. https://openstax.org/books/anatomy-and-physiology-2e/pages/1-introduction ↵
- “2032 Automatic Innervation.jpg” by OpenStax College is licensed under CC BY 4.0. Access for free at https://openstax.org/books/anatomy-and-physiology/pages/19-4-cardiac-physiology ↵
- Betts, J. G., Young, K. A., Wise, J. A., Johnson, E., Poe, B., Kruse, D. H., Korol, O., Johnson, J. E., Womble, M., & DeSaix, P. (2022). Anatomy and Physiology 2e. OpenStax. https://openstax.org/books/anatomy-and-physiology-2e/pages/1-introduction ↵
- Betts, J. G., Young, K. A., Wise, J. A., Johnson, E., Poe, B., Kruse, D. H., Korol, O., Johnson, J. E., Womble, M., & DeSaix, P. (2022). Anatomy and Physiology 2e. OpenStax. https://openstax.org/books/anatomy-and-physiology-2e/pages/1-introduction ↵
- “2036 Summary of Factors in Cardiac Output.jpg” by OpenStax College is licensed under CC BY 4.0. Access for free at https://openstax.org/books/anatomy-and-physiology/pages/19-4-cardiac-physiology ↵
- Betts, J. G., Young, K. A., Wise, J. A., Johnson, E., Poe, B., Kruse, D. H., Korol, O., Johnson, J. E., Womble, M., & DeSaix, P. (2022). Anatomy and Physiology 2e. OpenStax. https://openstax.org/books/anatomy-and-physiology-2e/pages/1-introduction ↵
- “2120_Major_Systemic_Artery.jpg” by OpenStax College is licensed under CC BY 3.0 ↵
- “Illu_capillary_en.jpg” by Unknown author is licensed in the Public Domain ↵
- “2131_Major_S” by ystematic_Veins.jpg” by OpenStax College is licensed under CC BY 3.0 ↵
- Betts, J. G., Young, K. A., Wise, J. A., Johnson, E., Poe, B., Kruse, D. H., Korol, O., Johnson, J. E., Womble, M., & DeSaix, P. (2022). Anatomy and Physiology 2e. OpenStax. https://openstax.org/books/anatomy-and-physiology-2e/pages/1-introduction ↵
- “2110_Pulse_Sites.jpg” by OpenStax College is licensed under CC BY 3.0 ↵
- Betts, J. G., Young, K. A., Wise, J. A., Johnson, E., Poe, B., Kruse, D. H., Korol, O., Johnson, J. E., Womble, M., & DeSaix, P. (2022). Anatomy and Physiology 2e. OpenStax. https://openstax.org/books/anatomy-and-physiology-2e/pages/1-introduction ↵
- “Combinpedal.jpg” by James Heilman, MD is licensed under CC BY-SA 3.0 ↵
- Betts, J. G., Young, K. A., Wise, J. A., Johnson, E., Poe, B., Kruse, D. H., Korol, O., Johnson, J. E., Womble, M., & DeSaix, P. (2022). Anatomy and Physiology 2e. OpenStax. https://openstax.org/books/anatomy-and-physiology-2e/pages/1-introduction ↵
- “2626 Renin Aldosterone Angiotensin.jpg” by OpenStax College is licensed under CC BY 4.0. Access for free at https://openstax.org/books/anatomy-and-physiology/pages/25-4-microscopic-anatomy-of-the-kidney ↵
- Betts, J. G., Young, K. A., Wise, J. A., Johnson, E., Poe, B., Kruse, D. H., Korol, O., Johnson, J. E., Womble, M., & DeSaix, P. (2022). Anatomy and Physiology 2e. OpenStax. https://openstax.org/books/anatomy-and-physiology-2e/pages/1-introduction ↵
- Betts, J. G., Young, K. A., Wise, J. A., Johnson, E., Poe, B., Kruse, D. H., Korol, O., Johnson, J. E., Womble, M., & DeSaix, P. (2022). Anatomy and Physiology 2e. OpenStax. https://openstax.org/books/anatomy-and-physiology-2e/pages/1-introduction ↵
Establishes normal cardiac rhythm within the heart.
Normal electrical pattern.
Abnormal rate or rhythm
Period of contraction that the heart undergoes while it pumps blood into circulation.
Period of relaxation that occurs as the chambers fill with blood.
End diastolic volume.
The quantity of blood pumped out of the left ventricle with contraction of the heart muscle.
Measurement of the amount of blood pumped by each ventricle in one minute.
The number of times the heart beats per minute.
The condition in which resting rate drops below 60 bpm.
Heart rate over 100 beats per minute.
The force or strength of the contraction itself.
The force the ventricles must generate to pump blood against the resistance in the vessels.
Factors that increase contractility.
Factors that decrease contractility.
A blood vessel that carries blood away from the heart.
A microscopic channel that supplies blood to the tissue cells where nutrients and wastes are exchanged at the cellular level.
Small veins.
Blood vessel that returns blood to the heart.
Venous blood is located in venous networks within the liver, bone marrow, and integument.
Expansion and recoiling of the arterial wall
The passage of blood through the blood vessels.
The force exerted by blood on the walls of the blood vessels.
The ability of any compartment to expand to accommodate increased content.
Low blood volume.
Excessive fluid volume.
Excess fluid around the cells.
Controls fluid and electrolyte balance through coordinated effects on the heart, blood vessels, and kidneys.

