5.1 Electrocardiogram (EKG or ECG)
Respiratory therapists need to understand electrocardiograms (EKG or ECG) because they often care for patients with cardiopulmonary conditions where the heart and lungs are interconnected, meaning that changes in cardiac function can directly impact respiratory status and vice versa. Therefore, being able to interpret an ECG allows them to monitor a patient’s heart rhythm, identify potential cardiac complications, and make informed treatment decisions, especially in critical care situations where rapid intervention may be necessary.
An ECG is a noninvasive test that measures the electrical activity of your heart. An ECG records the electrical signals that travel through your heart each time it beats. The recording looks like wavy lines on a graph that a health care provider can interpret to identify abnormal heart activity. An ECG can show how fast your heart is beating, if your rhythm is regular or irregular, and the strength and timing of electrical signals in each part of your heart.
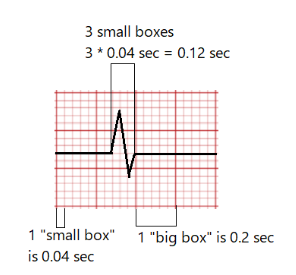
First, we will learn to measure time on graph paper. This is helpful when you need to know how long it takes for a particular wave to occur. A “small box” denoted by the thinner lines represents 0.04 seconds of time. The “big box” is denoted by the bold lines and is composed of five small boxes and represents 0.2 seconds of time. (See Figure 32.[1])
In this example, we will measure the wave complex drawn on the graph. We will start at the beginning of the complex (where it deviates upward from the baseline in this example) and end at the end of the complex (where it returns to the baseline). It is acceptable to estimate to the nearest small box because ECG wave forms rarely line up exactly on the graph lines. This example below measures the complex at approximately three small boxes wide. Each small box represents 0.04 seconds, so we know this wave on the ECG graph took place in 0.12 seconds (see Figure 32).
It is a good idea to get comfortable with measuring waves in this manner and calculating the time per wave, as it will help your ECG interpretation greatly. ECGs measure electrical activity in the heart. They do not measure actual movement, only the electrical impulses that cause muscle contractions. In a normal heart, the electrical impulse starts in the SA node and then travels from there through the atria to the AV node. The electrical impulse is held there briefly and then is allowed to continue on through the bundle of His to the Purkinje fibers into the ventricles.
View the following supplementary YouTube video[2] which demonstrates ECG interpretation for the beginner: 12 Lead ECG (Electrocardiogram) for beginners🔥🤯
ECG Waveform
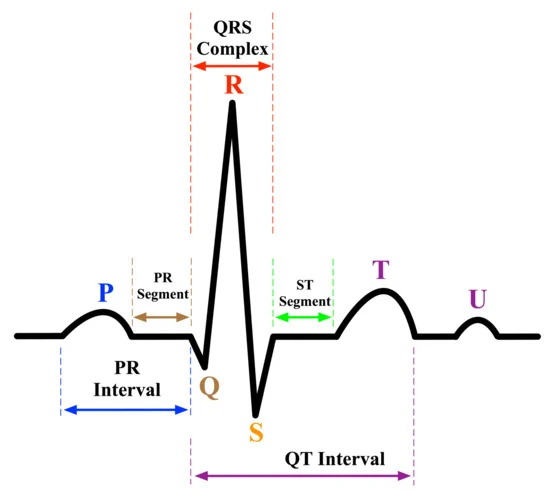
The heart’s electrical activity, visible on an ECG, includes several key components that reflect its rhythm and function (see Figure 33[3]). The P wave marks the electrical flow from the SA node through the atria to the AV node, causing the atria to contract. Following this, the PR segment represents a pause as the AV node temporarily holds the impulse, allowing the ventricles to fill. The PR interval, from the start of the P wave to the beginning of the Q wave, typically ranges from 0.12 to 0.2 seconds. The QRS complex shows the rapid conduction from the AV node through the bundle of His and Purkinje fibers, leading to ventricular contraction. After this, the T wave reflects ventricular repolarization. The QT interval, from the start of the Q wave to the end of the T wave, should be approximately 0.45 seconds, though it varies with heart rate. Finally, the ST segment represents the period from the end of the S wave to the beginning of the T wave, marking the transition to ventricular repolarization. Each component provides valuable insights into the heart’s function and rhythm.
View the following supplementary YouTube video[4] that will help you understand cardiac conduction and the ECG waveform: Cardiac Conduction System and Understanding ECG, Animation
Systematic Interpretation of Electrocardiogram and Cardiac Rhythms
Respiratory therapists play a critical role in managing patients with cardiopulmonary disorders, often working in high-acuity settings where rapid assessment and intervention can be lifesaving. A systematic approach to interpreting ECGs and cardiac rhythms is essential for respiratory therapists to recognize early signs of cardiac dysfunction, guide appropriate interventions, and collaborate effectively with the health care team. Given the close relationship between the respiratory and cardiovascular systems, understanding ECG patterns can help respiratory therapists differentiate between primary cardiac events and respiratory-induced changes, ensuring timely and appropriate patient management. By adopting a structured method of ECG interpretation, respiratory therapists can enhance their clinical decision-making, improve patient outcomes, and elevate their role as integral members of the critical care team.
- Measuring the Rate. Most ECG machines will automatically provide a rate, provided they are setup correctly. ECG machines usually measure the QRS complex rate as the overall rate. However, the easiest alternative way to measure rate is to count the number of QRS complexes in a 6-second strip and then multiply that count by 10. A normal heart rate is 60–100 bpm.
- Finding the P Wave. Is there a P wave for every QRS complex? Is there a QRS complex for every P wave? The ratio of P waves to QRS complexes should be 1:1 in a normal rhythm (discussed in more detail in the next segment). Noting a P to QRS ratio that is different from a 1:1 ratio will help you discern certain rhythms.
- Is the Rhythm Regular or Irregular? You should analyze the ECG or 6-second strip and ask yourself, do the P waves come at consistent intervals? Do the QRS complexes come at consistent intervals? “March out” means they all occur at consistent, regular intervals. It is most accurate to use a pair of calipers to measure this, but you can often see clearly when it does not march out in regular intervals, as with the irregular QRS complexes on Figure 34.[5]
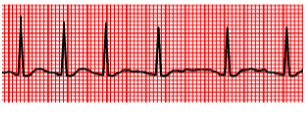
Figure 34. Irregular 6-second rhythm strip. - Is the PR Interval Prolonged? A normal PR interval measures 0.12–0.20 seconds. This is the time it takes for the impulse to travel from the SA node through the AV node.
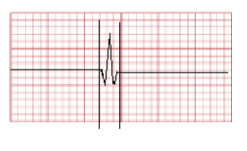
- Is the QRS Complex Wide or Narrow? A normal QRS complex is 0.12 seconds or less, which is referred to as a narrow complex. Three of the small ECG boxes are equal to 0.12 seconds (see Figure 35[6]). A wide QRS complex is considered anything above 0.12 seconds. You may see certain rhythms referred to as “wide complex” or “narrow complex”; these terms refer to the width of the QRS complex and will help you distinguish certain rhythms. We will discuss what these types of QRS complexes mean with regards to physiology in another segment.
- Are There T Waves? A normal T wave should point in the same direction as the QRS complexes.
Now it is time to put all the above information about the rhythm strip together. It is often helpful to have a diagram you use to measure and interpret each piece of the ECG to help you get into the habit of thinking about the parts.
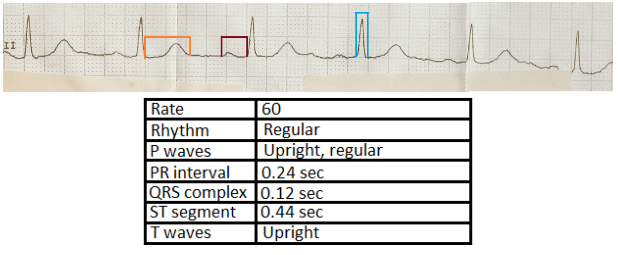
In the example below (see Figure 36[7]), note the following:
- The rate is measured at 60, as there are six QRS complexes in this 6-second strip.
- The rhythm is regular because the QRS complexes occur at regular intervals.
- The P waves are upright and occur at the same interval every time (red box).
- The PR interval, QRS complex, and ST segments are 0.24 seconds, 0.12 seconds, and 0.44 seconds in duration (blue box).
- The T waves are upright (orange box).
| This would be interpreted as a normal sinus cardiac rhythm. |
 |
Practice the systematic interpretation of ECG strips using this Rhythm Game.
12-Lead Electrocardiogram Placement
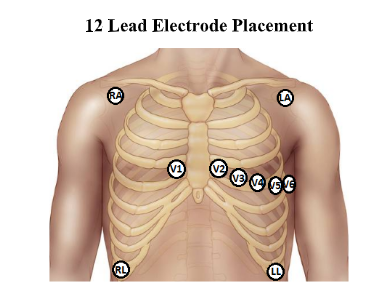
Respiratory therapists are often the clinicians who perform the task of 12-lead ECGs on patients; therefore, it is important to make sure leads are placed correctly for a 12-lead. (See Figure 37.[8]) V1 is the only lead that is located to the right of the sternum. V1 and V2 are placed at the fourth intercostal space to the right and left of the sternum, respectively. It is recommended to physically palpate the first four intercostal spaces when you place leads V1 and V2; the location is anatomically lower on the chest wall than it appears at a glance.
V3 and V4 are placed next, both in the fourth intercostal space. V4 should be placed in the fourth intercostal space directly below the nipple. This is also about the midclavicular line. V3 is placed in the fourth intercostal space directly but laterally placed halfway between V2 and V4.
V5 and V6 are placed in the fifth intercostal space. V6 is placed horizontally along the midaxillary line in the fifth intercostal space. V5 is placed in the fifth intercostal space, halfway between V4 and V6.
- “3 small boxes” by Nurses International Team is licensed under CC BY 4.0. Access for free at https://projects.nursesinternational.org/resources/ekg-guide ↵
- The Learn Medicine Show. (2023, April 2). 12 Lead ECG (Electrocardiogram) for beginners🔥🤯[Video]. Youtube. All rights reserved. https://www.youtube.com/watch?v=oLlx3Dj4AbE ↵
- “P wave” by unknown author, MDPI is licensed under CC BY 4.0. Access for free athttps://www.mdpi.com/2073-431X/10/6/82 ↵
- Alila Medical Media. (2014, April 29). Cardiac conduction system and understanding ECG, animation [Video]. YouTube. All rights reserved. https://www.youtube.com/watch?v=RYZ4daFwMa8&t=2s ↵
- “Irregular QRS Complexes” by Nurses International Team is licensed under CC BY 4.0. Access for free at https://projects.nursesinternational.org/resources/ekg-guide ↵
- “Normal QRS Complex” by Nurses International Team is licensed under CC BY 4.0. Access for free at https://projects.nursesinternational.org/resources/ekg-guide ↵
- “Example EKG Tracing” and “Putting it all Together” by Nurses International Team are licensed under CC BY 4.0. Access for free at https://projects.nursesinternational.org/resources/ekg-guide ↵
- “12 Lead Electrode Placement” by Nurses International Team is licensed under CC BY 4.0. Access for free at https://projects.nursesinternational.org/resources/ekg-guide ↵

